UFTrace - A Linux Profiler
Author: thothonegan
Tags: linux uftrace profiling c++
Found a new profiler for linux recently thats been pretty nice. Under Linux I generally use callgrind + kcachegrind which does a good job, but it takes a massive performance hit due to how valgrind works. The new tool, uftrace ( https://github.com/namhyung/uftrace ), instead uses hooks from the compiler.
First, you have to compile your code with either -pg or -finstrument-functions. Both of them essentially inject calls into your code when it starts and ends functions, allowing other tools to get your program's flow. In my case, i'm using -finstrument-functions because -pg caused a lot of weird issues as soon as inlining or optimizations was turned on. (In Catalyst, this is now enabled by --buildProfile DebugProfile or --buildProfile ReleaseProfile).
To record a profile, you run:
uftrace record [program]
and run through the program as normal. If you didnt install uftrace into the system, use LD_LIBRARY_PATH to point it to libmcount-fast.so. Now for the neat part, viewing the information.
UFTrace has several ways to display information about a trace. For an example, I'm using WolfExampleConsoleExample which is a simple program that tests outputing things using WolfConsole.
The first method is uftrace report which shows what functions spent the longest time including children (total time). Its output is a very nice table.
Total time   Self time       Calls  Function
==========  ==========  ==========  ====================================
21.483 ms    0.510 us           1  main
21.482 ms    0.706 us           1  WolfSystem::wolfMain
21.221 ms    1.615 us           1  WolfSystem::wolfMainInit
19.971 ms    6.833 us           1  WolfConsoleExample::Application::init
15.369 ms  151.195 us         308  WolfType::UTF8String::operator +=
15.042 ms   76.614 us         313  WolfType::UTF8String::reserveIfNeeded
...
In the case, we can ignore main since they're container functions, but can see that adding UTF8Strings is costing quite a bit of real time.
The second method is uftrace graph [function], which will do two things. First, it shows a backtrace of where the function was called. For example if we do uftrace graph 'WolfType::UTF8String::operator +=':
 backtrace #0: hit 4, time 183.368 us
   [0] main (0x440690)
   [1] WolfSystem::wolfMain (0x4577d0)
   [2] WolfSystem::wolfMainInit (0x457970)
   [3] WolfConsoleExample::Application::init (0x440d70)
   [4] WolfConsole::operator << (0x442210)
   [5] WolfConsole::Tree::toString (0x44c280)
   [6] _GLOBAL__N_1::s_simpleNodeAppendToString (0x44c370)
   [7] _GLOBAL__N_1::s_simpleNodeAppendToString (0x44c370)
   [8] _GLOBAL__N_1::s_simpleNodeAppendToString (0x44c370)
   [9] WolfType::UTF8String::operator += (0x443470)
The second thing it does is it shows a graph of the function itself, which can help you narrow down what the cost of things within the function are costing.
calling functions
=====================================
  15.369 ms : (308) WolfType::UTF8String::operator +=
 227.879 us :  +-(1232) WolfType::StringInterface::byteSize
  49.017 us :  | (1232) WolfType::UTF8StringRef::r_constVoidDataByteSize
            :  |
  14.932 ms :  +-(308) WolfType::UTF8String::reserveIfNeeded
   8.040 ms :  |  +-(308) WolfMemory::Allocator::allocate
   8.003 ms :  |  | (308) WolfMemory::HeapAllocator::v_allocateMemory

   ...
In this case, most of the cost is coming from reserveIfNeeded which is essentially a wrapper for malloc().
Now lastly, the coolest method (and the reason i was looking at uftrace in the first place). All of these are great, but they're still very commandline - sometimes you need a nice way to browse it. If you do utrace dump it gives you all the raw data so you can manipulate it. If you do uftrace dump --chrome > fire.trace and load it into google chrome's chrome://tracing however, you get:
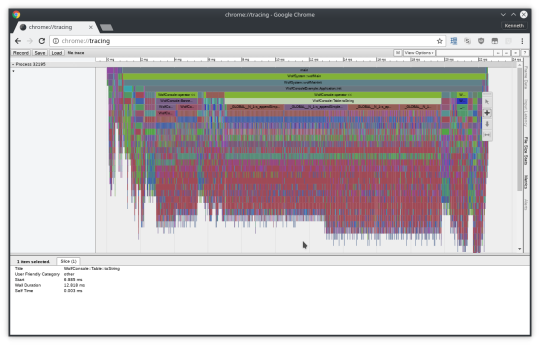
A nice little chart you can easily navigate around! It also has support for a few other formats, and lots of flexibility with the commandline tools to get information.
Minor Issues
So the few little minor issues. The first is having to compile your code in a different mode. Both valgrind and sampling based profilers dont have this issue. The second is the cost of a function call in every single function. In my chart, you can see a lot of tiny functions at the bottom as a long tail for function calls. A lot of them are things like std::less, std::forward, std::map internals, r_pointer() and other things that are 0 cost inline functions. A lot of my engine involves 0 cost safety wrappers around concepts (such as WolfMemory::Pointer which provides null call safety in debug mode, yet costs nothing in release mode). With the forced function call approach that -finstrument-functions uses, all of these functions then explode in cost due to the callback. I'm sure the callback is optimized to be as fast as possible since its called for every function call, but when the function is designed to literally cost 0, anything is a huge cost. While the slowdown doesnt seem to be as big as valgrind, it affects the profile vs a sampler approach. Of course, any function that does any real work will easily be greater than the profile cost.
Neither of these are big issues, but its just something to watch out for if using uftrace. Its been pretty useful so far, and is a nice in-between from callgrind and Instruments.